Powerful reporting = easy reporting

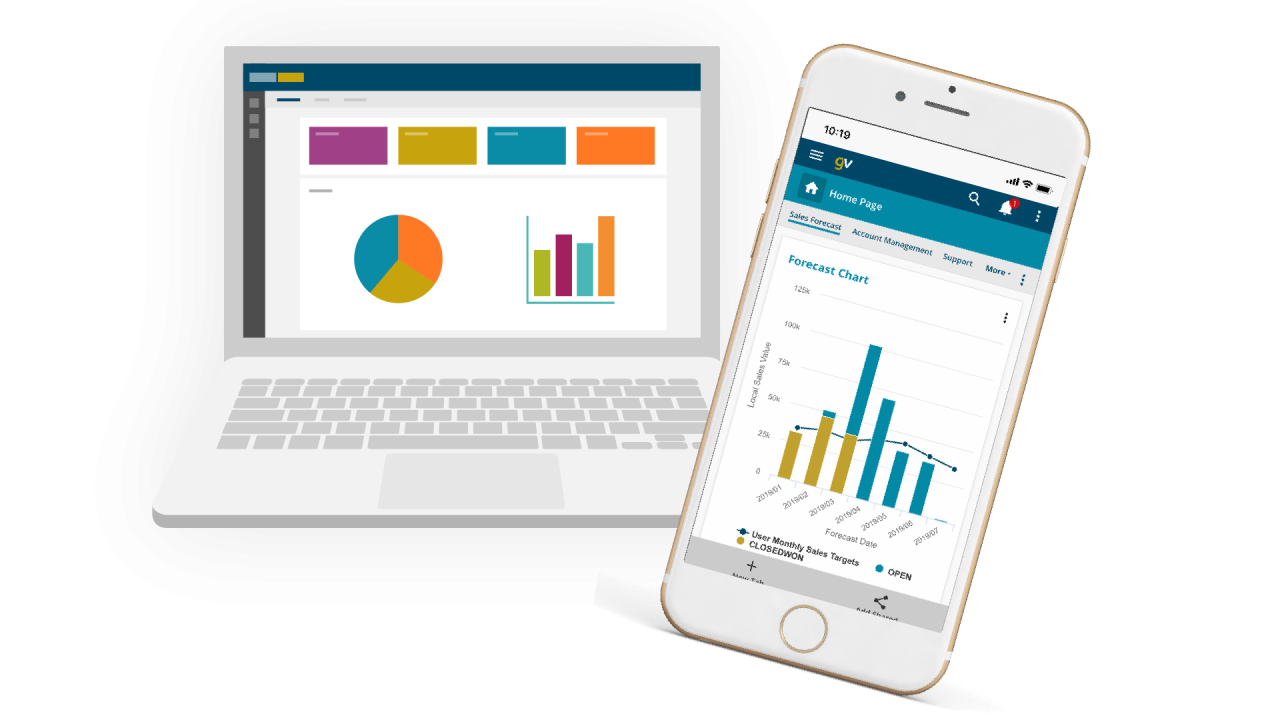
Using Gold-Vision’s reporting you can quickly identify your strongest sources with real-time customer insights on any device, at any time, and anywhere.

You can also segment your data to create cross-functional reports. With powerful, automatic reporting and distribution that will keep your team up-to-date with little effort.

  • Forecast revenues accurately. Track every sale and measure the revenue potential of each lead through your sales pipeline
  • Distribute your reports automatically to all your team members with little fuss
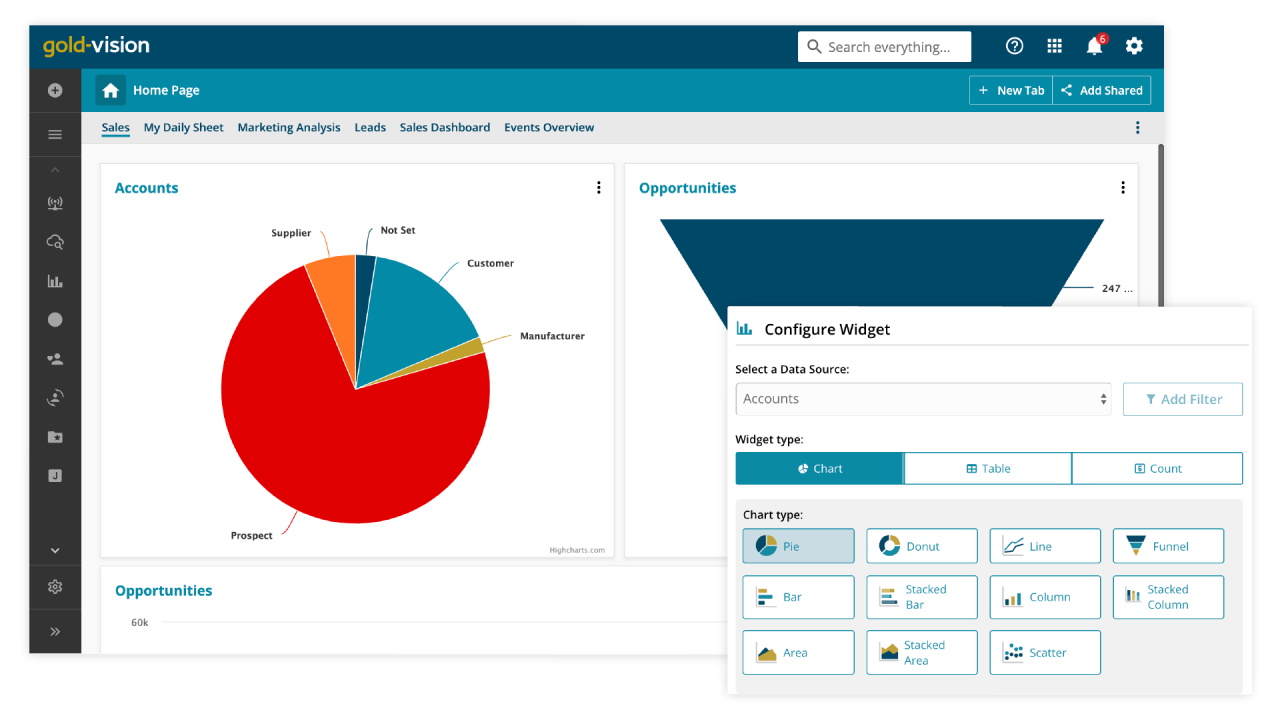
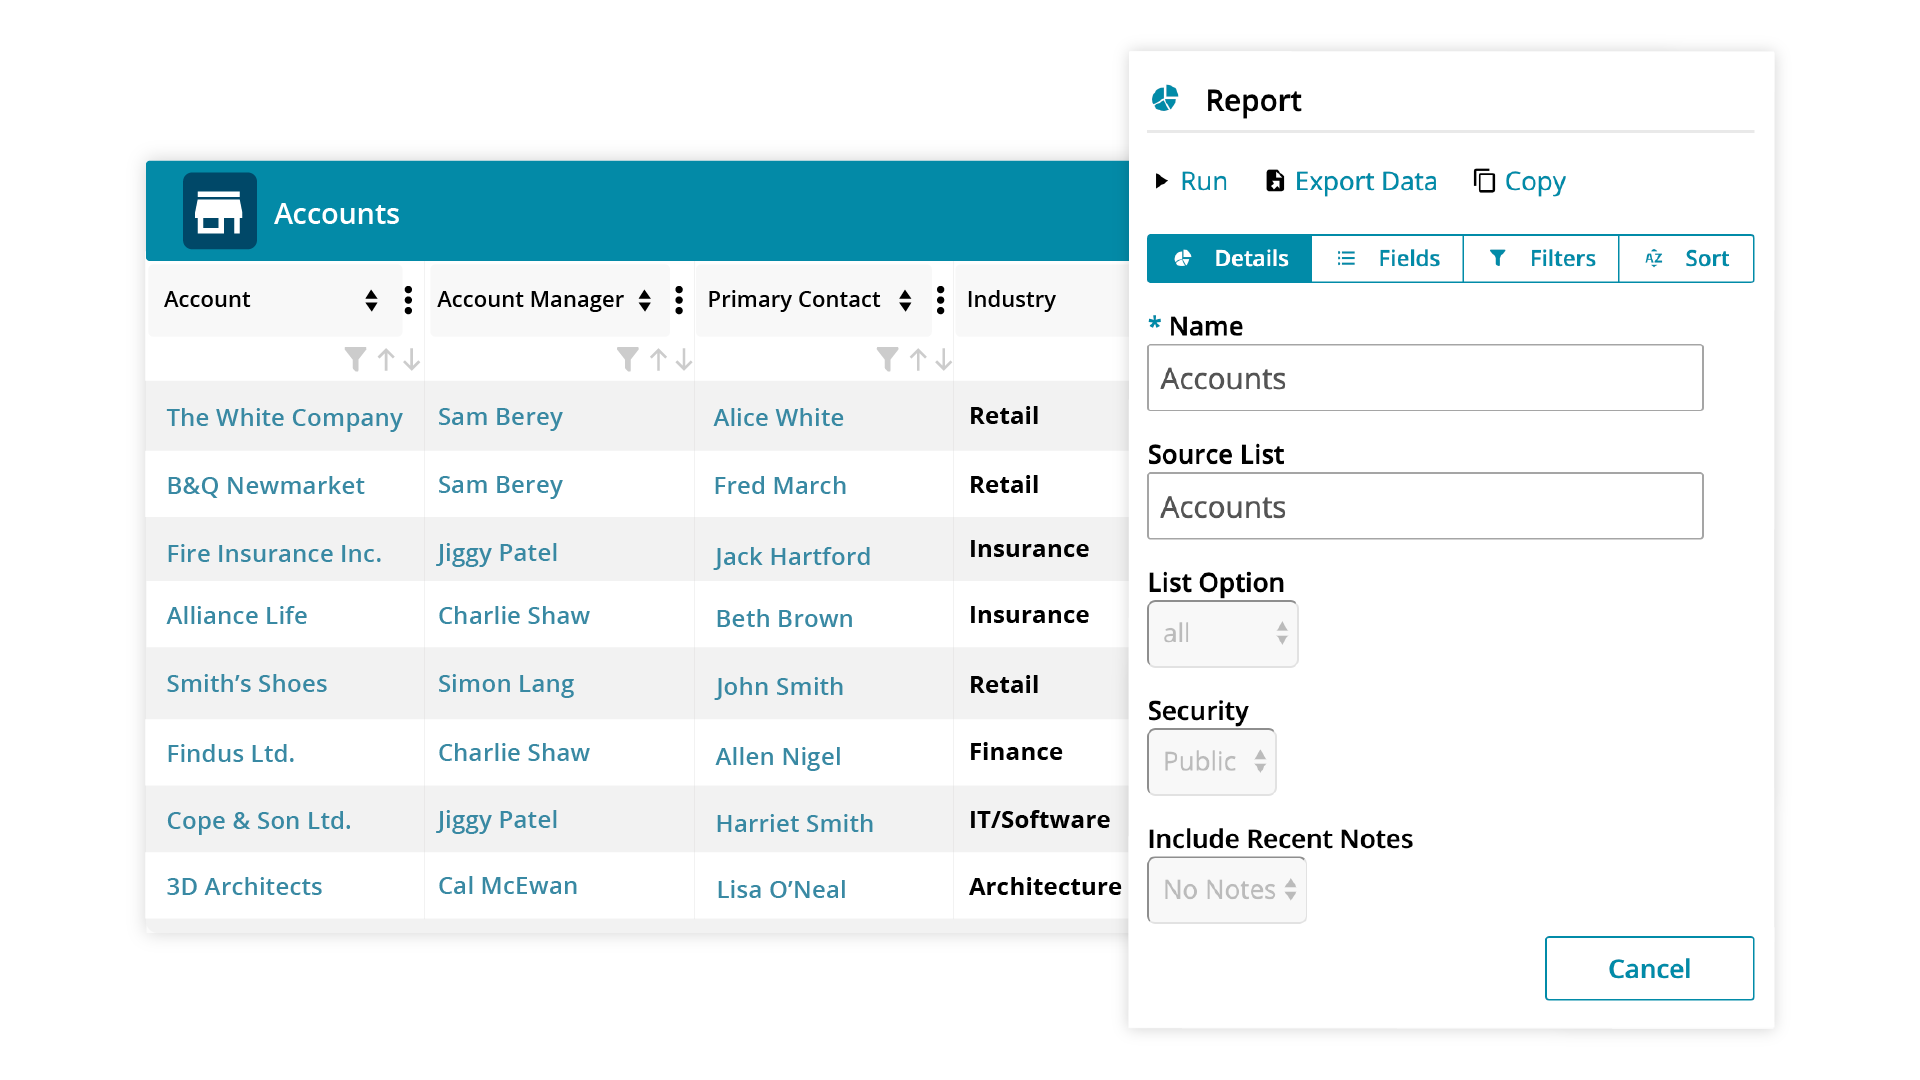
  • Choose from a variety of standard reports or create your own to get quick and accurate insights. Download reports for deeper analysis, or edit and refresh them.

Dynamic dashboards

With Gold-Vision’s dynamic interface you can create your own attractive dashboards that are simple to share.

Reduce time spent on meeting preparation and reports with real-time measures

Easy to create to your own specification, Gold-Vision dashboards enable quick insights and fast reactions to business performance.

  • Bring insights from different areas of Gold-Vision together into one clear view. For example, view your sales pipeline, opportunities and contract sign status on one dashboard
  • Create attractive dashboards based on your needs. Choose from charts, counts, widgets and more
  • Stop preparing endless reports for meetings. Create team specific dashboards for quick and regular access
  • One view access with the option to dig deeper for more detailed analysis

User-defined reports

With user-defined reports, you can generate your own reports from any list view in Gold-Vision. You can also set these reports to run as and when you need them, depending on your needs.

Simply filter the list based on criteria that matters to you, adding and removing fields and columns to include only the data that matters. For instance, you can use user-defined reports to generate a table of accounts sorted by their account manager that is then grouped accordingly. That way, you can have a table with lots of information, organised in a way that is easy to digest and action.

You can also use user-defined reports to export data out of Gold-Vision as a CSV. or Excel file that is ready to be shared externally or imported into other systems that you might be using.

New_Enhanced reporting

Integrated reporting

To improve results you need to measure what you’re doing and act on your advantages. To do this you need to integrate your data. By doing so you can:

  • Manage your sales opportunities in the same place as you manage your customer support queries
  • Run events in the same platform as your email marketing.
  • Report on any of it! Cross-functional analysis shows you how your processes interlink and how that impacts on your bottom line.

Integrating your key systems with your CRM completes the picture, enabling fast reporting and live dashboards.

What can Gold-Vision do for your business?

Arrange a demo