You’ve put all the hard work into creating your landing page and now it’s live – hooray! But now you need to keep an eye on its performance and make sure it’s doing as well as you’d hoped.

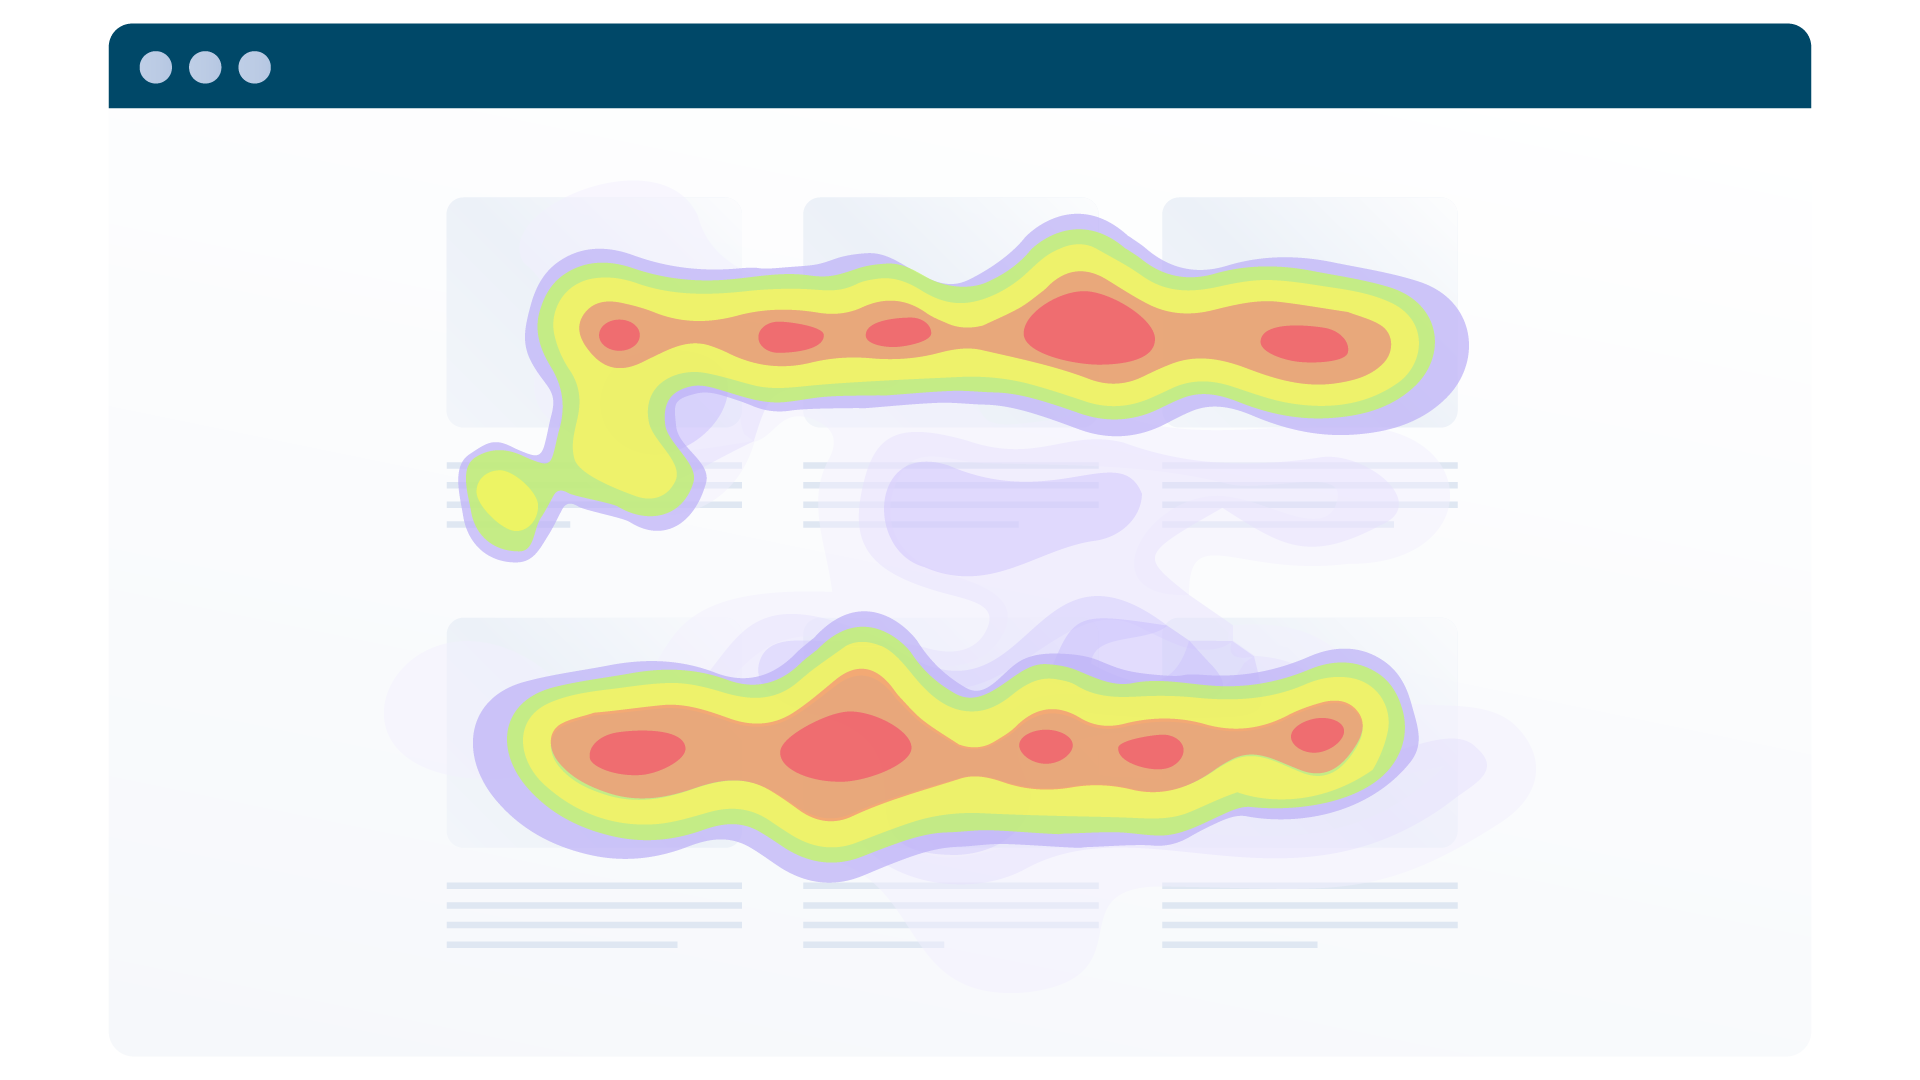
Are people scrolling through the page? Where are they looking and clicking? How long are they spending on the page? Are they answering your calls to action?

The more insights you can gather, the better placed you are to make any changes needed to improve the performance – and ultimately, conversions – from your page.

However, analytics is something that you either love to dig into or find as interesting as watching paint dry. Either way, you can’t avoid it – so hopefully with the help of this blog you’ll realise that focusing on four of the most interesting metrics will yield results and save you time wading through every available statistic

1. Bounce rate – the first impression

Bounce rate is defined by Google as “the percentage of sessions that were not engaged”. Think about every time you go onto a web page, and for whatever reason, go straight off it without exploring further.

The reason why I think this is worthy of being classed as one of the 4 most interesting landing page metrics to watch is that this simple metric gives you a good idea of how effective – or not – your web pages are.

The reason for a high bounce rate will vary from page to page, and depend on things like what its purpose is, how people are finding it, and what you want them to do once they are there.

TOP TIP: Bounce rate used to be visible by default in Google Analytics, but after the release of GA4 it is no longer shown in your reports without a little customisation. Luckily, it couldn’t be easier to add it back in – just follow these steps as laid out by Google and you can save it to your reports in just a few clicks.

So, what can you do to optimise your bounce rate?

  • Think about the journey to the page in question. Are people seeing what they expect? For instance, if they’ve come from a PPC ad, is the copy on your page relevant to what enticed them in the first place to click through?
  • This also applies to organic traffic. If someone has searched using a keyphrase or keyword and your page has come up, you need to make sure that the content on your page is relevant to their search query and intent
  • Ensure your page and wider website are mobile-friendly. If someone lands on your page from mobile and can’t make sense of the page because it’s not optimised, they’re going to get frustrated and leave
  • Make sure the destination URL is working and not serving visitors with a 404 error
  • Finally, check and test your design. Avoid using things like obstructive pop-ups that will irritate and put off visitors, check page load time is low, and ensure that your CTAs are clear, easy to find, and enticing.

If you make the changes above, then you should start to see your bounce rate go down and your landing page engagement go up – simple! However, if you’re looking for some more in-depth advice on how to improve your landing pages, we’ve got a blog for that!

2. Engagement rate – the other side of the story

Engagement rate is the direct opposite of bounce rate and is defined by Google as “the percentage of engaged sessions on your website or mobile app.”

For a session to count as ‘engaged’ in GA4, a visitor must do one or more of the following:

  • Stay on the page and actively ‘engage’ with it for 10 seconds or more
  • Have 2 or more screen or page views
  • Trigger a conversion event (e.g. submitting a form)

If you’ve followed the steps from the previous point to optimise your bounce rate, then you should start to see your engagement rate improve. But how do you know what counts as a good engagement rate?

As with most things of this kind, it will vary depending on factors like your type of business and industry, but I have found some good benchmarks that you can use to get started with:

Source: https://nobleintentstudio.com/blog/ga4-is-all-about-engagement-what-are-good-engagement-metrics/

3. Conversion rate – turning visitors into leads

Conversions mean different things to different people, depending on factors like your type of business, your industry, and the type of landing page. For instance, it could be as straightforward as getting visitors to purchase a product. For others, it might be demos arranged, or free trials activated. It could even be resource downloads in exchange for information. Whatever conversion means for you is something that you will need to pause and think about before doing anything else.

Essentially, your landing page conversion rate can be worked out as follows:

When it comes to optimising your conversion rates, you may have come across stats like “a good conversion rate for landing pages is above 10%” and “the average conversion rate is between 2 and 5%”. While these are interesting to note and could be helpful to set initial benchmarks, you must remember that average conversion rates can vary wildly from industry to industry.  

But there are some simple things you can do to optimise your conversion rates and increase the amount of leads your landing pages are generating for your business:

  • Make your CTA clear and eye-catching
  • Experiment with different CTA phrases
  • Make sure the rest of the rest of the page is working to entice people to complete your CTA – highlighting what makes your products/services unique
  • Make sure any forms you have are easy to fill in, aren’t cluttered with too many fields, and look visually appealing
  • Use web tracking tools like Google Analytics and Mouseflow to better understand how people interact with your page

TOP TIP: To see your conversions in Google Analytics, you must set them up first for them to appear in your reports. You can find a simple-to-follow guide on how to do this here.

The final point that you’ll see me mention again and again is to test, test, test. Don’t be afraid to experiment with different layouts, copy, CTAs, imagery, etc. Just be sure to do it incrementally so that you can tell what changes are having a positive or negative impact on your page’s conversion rate.

4. Heatmaps – understanding user behaviour

This is a little bit different to the other metrics on this list, but I think if we’re looking for interesting, it doesn’t get more interesting than heatmaps (in my opinion).

Unfortunately, heatmaps aren’t something you can get through Google Analytics. However, I would say it is well worth investing in the right tool to get access to exactly how visitors are engaging with your landing pages. We realised the importance of getting this extra insight a few years ago and opted for a tool called Mouseflow, which gives us access to a variety of heatmaps, including scroll, click, attention, and movement.

TOP TIP: If you’re not sure if something like Mouseflow is worth the investment then they have a free version that you can get started with and see if it’s right for you!

Each of these heatmaps helps you piece together a picture of your visitors’ engagement on the page, helping you to interpret and ultimately take action to improve areas that you can see aren’t working as well as expected.

For instance, with a click heatmap, you can see where people are clicking on the page (who’d have thought it!). What this gives you is a valuable insight into whether people are expecting to be able to click on elements of your page that aren’t clickable but maybe should be to prevent their frustration and improve their journey.

Scroll heatmaps show to what depth people explore your page, giving you a simple aggregate of whether people see and interact with your content as you expect. This is vital as you can see if elements that you consider to be important are being seen, and if not, you can move them to an area of the page that gets the most attention.

You can read more about the different types of heatmaps Mouseflow offers here.

We’ve found heat maps to be an invaluable tool to have access to, especially when we’ve needed to redesign our landing pages to increase conversions. We’ve been able to make informed decisions on which small changes to make to improve the page performance because they help you understand your visitors’ behaviour and what they want from your pages.

Final thoughts…

By keeping a watchful eye on these four landing page metrics, you can uncover valuable insights, make informed decisions, and ultimately enhance the performance and conversions of your landing pages. Whether you love delving into analytics or find it as interesting as watching paint dry, these metrics provide a streamlined approach to efficient analysis, saving you time and guiding your efforts toward success in the digital landscape.

Supercharge your marketing experience. The all new marketing product from Gold-Vision. Find out more.